
After the crisis that is hitting and sinking the GDP of all countries, stocks seem to have taken a counterintuitive direction. The "impressions" of money by the Central Banks seem to have encouraged the recovery of the stock markets. However, there are many voices that are raised warning of the unusual and even irrational of these bullish reactions. If not, some sectors seem to have recovered better than expected, and others not so much. This form of recovery has led some analysts to predict that the recovery will be K-shaped, and not in L, V, or how various letters of the alphabet have been suggested to explain how it would come. In the form of K, it is intended to explain the polarity that will exist between the sectors, one of the winners being the technology sector. But is this recovery real?
Many people who invest, both technical analysts and fundamental analysts, miss certain behaviors of a particular group of stocks. These are about some such as Zoom Video Communications, whose increase since the beginning of the year whose value was $ 68 reached a few days ago $ 478 per share, an increase of just over 600%. Another great example has been Tesla, whose stock went from $ 84 at the beginning of the year (Split included) to trading above $ 500 a few days ago, a rise of 500%. What's going on? Could they really have been the winners or are they overrated? Without going into financial analysis of companies whose stock market performance has been well above the average, we can choose to have a somewhat more global vision of where the markets are located. For this we will use the «Buffet Index», which we are going to talk about today.
What is the Buffet Index?
The most important indices in the United States are known to the entire investment community. Among them we have the Nasdaq 100, which includes the 100 most important stocks in the technology industry, the Dow Jones Industrial Average 30, which measures the evolution of the 30 largest public limited companies in, and the S&P 500, where it has been the most representative of the North American economy and groups some 500 large-cap companies. However, there are some other indices that are not so well known, but no less important. The index on which the formula to extract the Buffet index rests is the Wilshire 5000 index.
The Wilshire 5000 is the index on which all notable companies are listed, excluding ADRs, limited companies and small companies. It can be found under the ticker "W5000". The Wilshire, has also had a remarkable recovery like its analogues. All this in a context where confinements, stoppages in shops, and economic havoc due to the interruption of the "natural" economic cycle has been interrupted. All these events resulting in very important and not inconsiderable drops in the GDP of the different economies.
The singular case that concerns us in this article and that has set off the alarms is that the Buffet index, which measures the ratio of the total capitalization of the Wilshire 5000 to GDP (Gross Domestic Product) of the United States is at extremely high levels. Thus, this index has worked until today as a great predictor of the most important stock market crashes. An example, the great relevance it took in the dot-com bubble. To understand it, let's see how it is calculated.
How is the Buffet Index calculated?
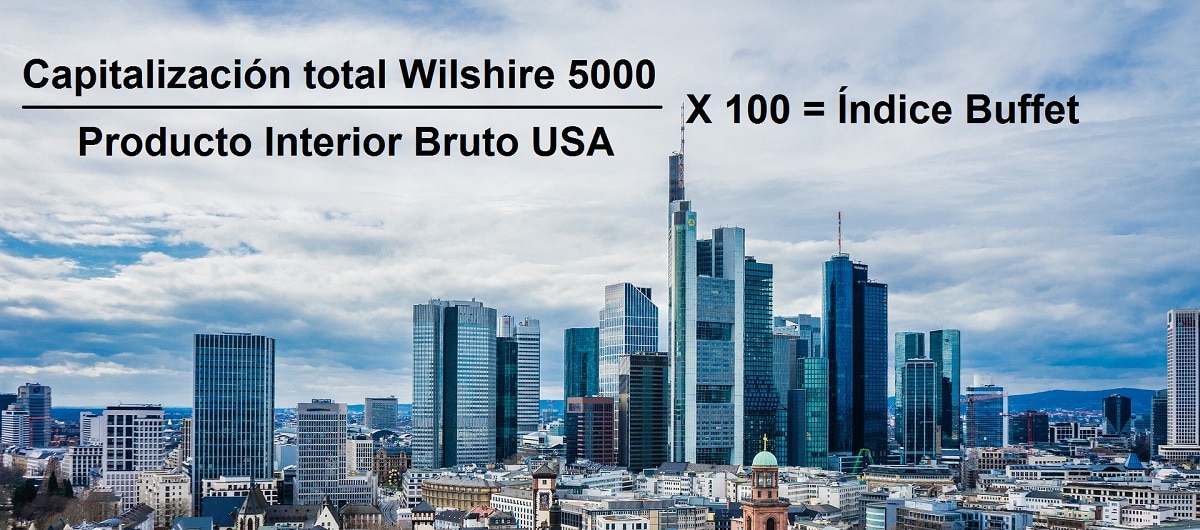
The way the Buffet Index is calculated is very simple actually. It's about taking the total capitalization value of the Wilshire 5000 and divide it by the U.S. GDP. The resulting number is the percentage expression of said relationship, and to express it as a percentage, which is how it is actually given, it is multiplied by 100.
To correctly interpret the result, we must understand what the percentage is telling us. To have a guide and / or reference, the following relationships are enough.
- A percentage less than 60-55%. Would mean that the bags are cheap. The lower the percentage, the greater the undervaluation they have.
- A percentage around 75%. Neither expensive nor cheap, is the historical average. The market would be fairly balanced. If the environment is good, stocks are likely to have an upward journey in this scenario. On the other hand, if the environment becomes more hostile, lower prices would be possible.
- A percentage greater than 90-100%. There are those who prefer the 90s line, and others the 100 line. But how can it be deduced, in these scenarios the bags start to get expensive. The higher the percentage, the more overvalued they are.
When there was the crash of the dot com, the bags were at 137% and fell to 73% (its historical average we could say). In the financial crisis, stocks were around 105% and fell to 57% (that is, they were undervalued).
After the predictions… Where are we now?
The Wilshire 5000 has a current capitalization of around $ 34 trillion. A few days ago he even capitalized over 36 trillion! This in perspective of the GDP of the USA that at present is due to the fall of the economy in 19 trillion gives us a value of 174% (34 trillion divided by 19 trillion multiplied by 5). Are Stock Exchanges Overvalued? The answer a priori and without a doubt would be yes. Never before, not even in the dot-com bubble with its valuation around 137%, have they reached the current record of 174%. What is happening and what can we expect?
Frankly, after years of investing experience, it is sometimes difficult to anticipate what will happen, but when it does, we have always had somewhere to look. It is very possible that the Buffet index is warning us, as on previous occasions, of a future stock market crash. However, the appearance of a new generation of investors and speculators, currently known as Robinhood's due to the appearance of apps that allow investment at low costs, somehow shape the financial climate of the markets. This, added to the strong inflows of money to the markets and economies by the Central Banks, also raise concerns about an upturn in inflation, which when moving to the economies, will inflate prices, reducing the relationship between GDP and income. market capitalization.