
The Laffer curve is a graphical representation of the relationship between tax revenues and tax interest rates. The purpose of the curve is to show how tax revenue fluctuates when interest rates change. The creator of this curve is the American economist Arthur Laffer, who argues that an increase in the tax rate does not translate into an increase in collection, because the tax base collapses.
Laffer argues that at the moment in which the tax rate is set to zero, the revenue of the treasury does not exist since in reality no tax is being applied. In the same way, if the tax rate is 100%, there is no tax revenue either because no company or individual would agree to produce a good whose income it generates would be fully used to pay taxes.
According to Laffer, if at the extreme points of the tax rates, the tax collection is simply zero, the result is the existence of an intermediate rate between these extremes that allows the maximum possible collection. Considering the fact that inflation in any economy depreciates the value of money, inflation can be seen as a tax that is assumed as the loss of value as a consequence precisely of this phenomenon and that the holders of the true balances of money constantly face. money, non-indexed bonds and financial instruments.
This is basically why The Laffer curve can be used to analyze the effects of variation in inflation in any economy.
The Laffer curve and taxes
We can say then that the Laffer curve is a graphical representation where you can see the way in which the economy of a country is affected by the fact that the income of a government depends exclusively on the taxes that are obtained. The curve also tries to explain that the increase in taxes does not necessarily translate into obtaining more money.

Consequently, the Laffer curve shows that when a government increases its tax collection beyond a certain point, You can get much less money compared to lowering your taxes on goods and services. In addition, when a government increases its taxes excessively, the cost resulting from adding that measure to the costs and profit margin of any good or service, it may not be convenient to offer said good or service to whoever is offering it or to acquire it. for whoever is suing it.
In other words, that the producer or the buyer decided that they are not interested or directly, that they cannot offer or buy that good or service. Therefore, the sales of that good or service would collapse and as a result, the amount of taxes collected would also collapse.
Understanding the Laffer curve
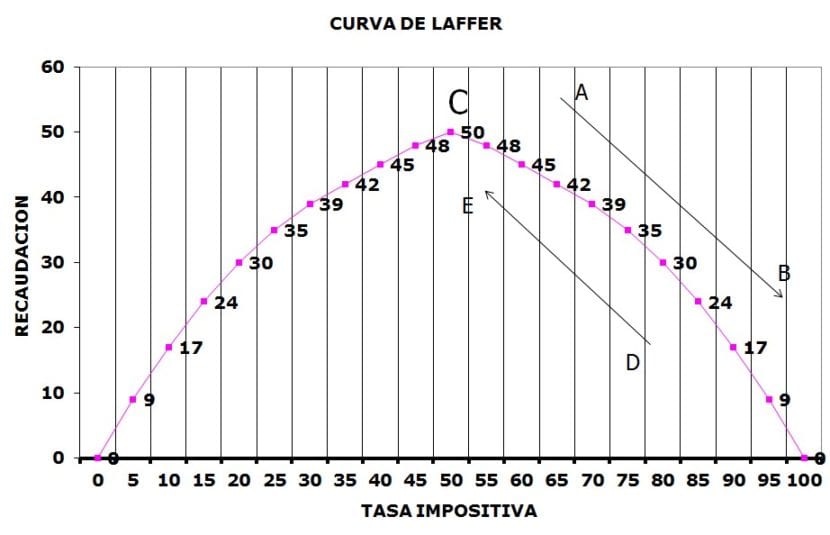
On the Laffer curve, on the the abscissa axis the possible tax rates are placed on the profits of the product identified ti , which are measured in a percentage from 0% to 100% and where t0 equals 0%, while tmax equals 100%. On the other hand, the axis of the computers is the one that is used to represent the income of the government in money and identified by You.
El Laffer curve graph It can be read this way: when the tax rate on a good or service is t0, the government then makes no profit by collecting taxes, since the collection of taxes is non-existent. As the government increases taxes more, a good or service makes more profits and consequently the collection increases.
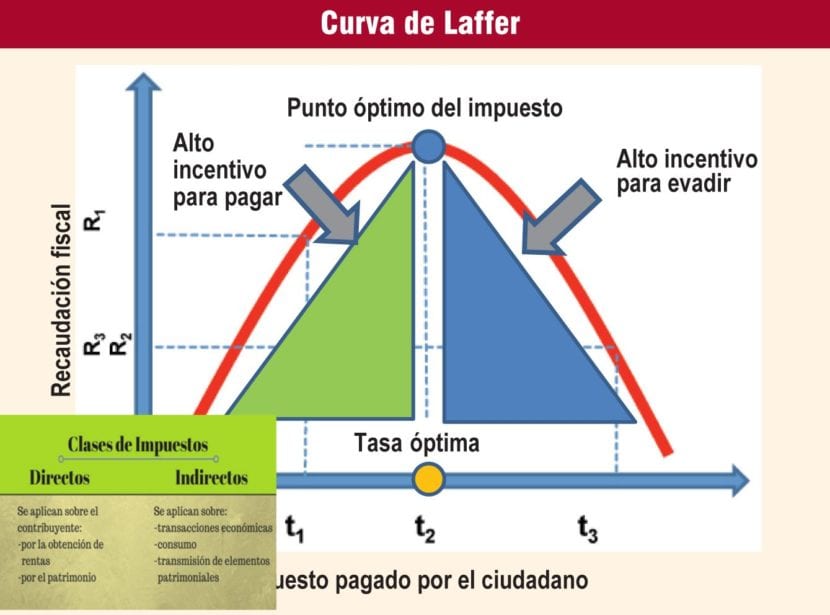
Nonetheless, the increase in government earnings generally occurs up to t *, which in this case is identified as the ideal collection point. In other words, this would be the level of tax rate that allows the government to obtain the most money through the collection of taxes.
Moreover, starting from t *, the increase in taxes on said good or service, makes producers and buyers less interested in producing and buying that good or service, each for their own reasons. In the case of producers, because basically each time they would earn much less, while in the case of buyers, because they would frequently face more increases in the final purchase price.
Considering that the tax collection corresponding to t0 and tmax, is non-existent, the result is that there must be an intermediate tax rate between these extremes, which in theory represents the maximum amount of money collected. All this is based on Rolle's Theorem, in which it is argued that if the income of the treasury is a continuous function of the tax rate, consequently there is at least a maximum at an intermediate point of the interval.
Un potential result of the curve is that if the government increases the pressure of taxes above a specific percentage t *, the increase in taxes will become counterproductive, since yields or rates of return gains are obtained that are increasingly lower.
In other words, they begin to obtain a lower collection due to the fact that the marginal producer no longer exists, others what they do is operate in the black market, while some choose not to obtain profits because the government much more than what they actually get for the tax. As a result, the Laffer curve suggests that a reduction in taxes would increase revenue only if current tax rates were kept to the right of the maximum point of the curve.
The Laffer curve represents the premise that changes in tax rates generate two closely related effects on tax revenues: the economic effect and the arithmetic effect. In the case of the economic effect, the positive impact of tax rates on labor, product and employment is recognized, while high tax rates produce an opposite economic effect by punishing participation in activities with the increase in taxes.
For its part, the arithmetic effect has to do with the fact that if the tax rate is low, then tax revenues are reduced as a consequence of the amount of tax collection, while the opposite occurs if the tax rate is increased, since the collection through taxes is equal to the tax rate that is multiplied by the collection that is available for taxation.
As a result and in accordance with the economic effect, with a 100% tax rate, the government in theory would not get any revenue because taxpayers would change their behavior as a result of high taxes. Basically they would not have any motivation to work or in their case they would choose another way to avoid paying taxes, including resorting to the black market or simply using the barter economy.
How is the inflation tax related to the Laffer curve?
With inflation frequency it is seen as a tax since it depreciates the value of money, and consequently, when there is inflation, if agents want to keep their true balances constant, then they have to increase their nominal money. This is why even though Laffer designed the curve to represent the income tax in the United States, it can actually be applied to the inflation tax model.
On the one hand seigniorage is the income or utility that governments receive for being solely responsible for making money, the inflation tax represents the capital loss of all those who obtain their profits as a result of inflation. When you have an economy that does not grow, both inflation and seigniorage coincide because inflation is the same as the growth of the quantity of money.
However, when you have a growing economy, seigniorage and inflation differ since the demand for money can increase as a result of increased income. Not only that, it is also possible that the Central Bank establishes the highest demand as the highest supply without inflation, but collecting profit. This means that even with zero inflation, it is still possible to collect seigniorage as a consequence of the increase in the demand for money.
The relationship between inflation and seigniorage can be seen in the Laffer curveConsidering that as inflation increases, it does not mean that collection will also increase since the money obtained is less. When inflation is zero, seigniorage is also zero. Furthermore, if the demand for money declines at a faster rate compared to inflation, it is to be expected that seigniorage will decline steadily as inflation rises indefinitely. This occurs because agents begin to convert their real balances into assets with less liquidity, but with a positive nominal return.