
This time we are going to talk about Gini index To do this, we will make a brief introduction about what a index is numerical representation of existing variations With respect to a phenomenon of any type, the phenomena can be of any kind, but its main conclusion is a graph that determines at a glance all the statistical data, this for the purpose of dissemination and / or understanding of the information.
An inequality index is the measure that summarizes the way in which a variable is distributed, whatever it is, among a set of individuals. In the case of economic inequality, the measurement variable is usually the spending of families, cohabitants or individuals. The Italian statistician Spread Gini, I devise an indicator whose use is to measure the level of inequality among the existing inhabitants of a specific region. Unlike the index, the coefficient is calculated as part of a proportion of the areas in the diagram of the well-known "Lorenz curve"
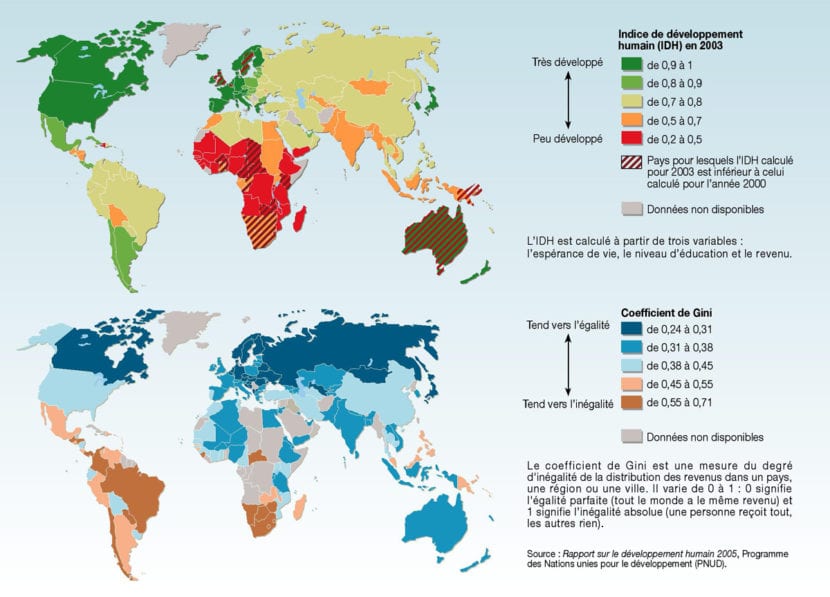
The Gini coefficient comprises a number between 0 and 1, where 0 corresponds to perfect equality, where everyone has the same income, while the numerical value 1 corresponds to perfect inequality, where only one individual has income and everyone else has none. The Gini Index is the Gini coefficient, but expressed in reference to a maximum of 100, unlike the coefficient that corresponds to the decimal numerical values that exist only between 0 and 1, this is to speed up the understanding of graphs , as well as the dissemination of the results obtained.
Within the classification of inequalities there are two large measures that are used in the literature, these groupings are: positive measures, which correspond to those that do not refer to social welfare. While there are also the normative measures, which, unlike the positive ones, are based on a direct welfare function. Depending on the selected indicator, the norms or parameters with which the observed income distribution is compared are defined.
Part of the properties of the Gini index or Gini coefficient are:
- Normally a definite integral is used to determine the area between the line of perfect equity and the Lorenz curve, this is considered as the ideal procedure, however, there are also cases in which the explicit definition of the Lorenz curve is unknown, Therefore, other methods are used, such as various formulas with a finite number of addends, the procedures and formulas vary according to the consideration of the case.
- Although the desired result is a graph that presents the inequality indices in a simple and practical way, it is not highly recommended that a visual evaluation be carried out when it comes to two Lorenz curves, since this evaluation may be erroneous, in Instead, it is recommended to compare the inequality that each one represents separately, calculating the Gini indices corresponding to each curve.
- Any Lorenz curve or rather; all Lorenz curves pass through the curve or the line that joins the points at the following coordinates: (0, 0) and (1, 1)
- The coefficient of variation table has properties that are comparable to those of the Gini index.
The Lorenz curve.

The Lorenz curve is the graphical representation used to represent the relative distribution of a variable within a given domain. Commonly, the domain in which this curve is reflected is a representation of a set of goods or services in a region, this by applying the Lorenz curve in conjunction with the Gini index or Gini coefficient. The authorship of this curve is Max O Lorenz in 1905.
Relationship between the Lorenz curve and the Gini coefficient.
Together with the Lorenz Curve we can calculate the Gini index, simply dividing the remaining area between the curve and the "equality" line, this by the total area that remains under the curve. In this way we obtain the coefficient or in turn multiplying the result by 100, we obtain the percentage.
Both the Gini index and the Lorenz Curve are developed as methods to identify inequalities between the population of a territory (nation, state, locality, etc.), understanding that the more equity exists among the inhabitants, the greater the approximation of the curve to a perfect line, while its opposite, a great inequality between the population of a territory, the curve becomes more and more pronounced.
What is the function of the Gini Index?
Within the study of inequality, there is the provision of multiple and diverse ways of describing the way in which income is distributed among the different groups of individuals in a society or group of people in a territory, some of these methods are such as : the ordering of the information, the inequality indicators and the scatter diagrams.
The fact of elaborating a diagram for the visualization of the income distribution is a really useful function for the analysis of the inequality, since it allows us to identify the aspects of the shape of the distribution that with other methods would not be possible or at least would be a more complicated task.
The applications of the Gini index.
There is a degree of economic inequality in a particular society and the evolution of this society over time becomes a topic of interest to many economists and public opinion in general. There are various analyzes that are carried out regarding the evaluation of the degree of inequity present in a society. During the history of economic analysis, various indicators have already been proposed for the well-known study of inequality; These, however, have not had such fruitful results as the one called by scholars of the subject as the "Gini Concentration Coefficient". As this index is the easiest to interpret, it is also constantly used as a reference for debate on the functioning of inequality and its effects on the population's standard of living in a region.
Among the first works or rather the first work that proposed the use of social welfare functions to measure inequality dates from the year 1920, By DaltonDuring that investigation, Dalton, proposed to calculate and observe the loss of well-being caused by the equitable distribution of income among people. Using a separable, symmetric, additive, and necessarily concave utility function of income, Dalton defined what would later become known as the Dalton Index.
Considerations about the Gini index.

- Within the theory, 4 alternatives are considered to produce data ordering, despite this, the ones that are used the most with a lot of recurrence are the "frequency distributions" and the "Lorenz curve", the least used, but still very efficient. they are the "parade diagrams" and the "logarithmic transformation."
- What is the indicated variable to measure inequality? Within the empirical work, there is a debate about the variable that could be considered "appropriate" for the evaluation of income concentration. There are two major variables that govern the controversy in this debate; per capita income or total household income. It could be said that both variables are correct, all according to the need to be covered with respect to the research to be carried out. For this reason, it is necessary to ask in the first instance, what is the purpose of this measurement? In order to continue or proceed to the choice of the variable that corresponds to this particular case.
- Consider the disaggregation of the Gini index. Within the inequality analysis, decomposition is a central axis, since we must know the origin of the major imbalances that affect equity at a level as basic as the household.
- Despite the popularity and ease of calculation procedure, the Gini index does not comply with the property of “additive decomposition”. By this we mean that the calculation carried out for a certain subgroup or subgroups will not necessarily always coincide with the value of the coefficient of the ordering of the total population by income levels.
- What are the sources of data for measuring inequality? In theory, books and most articles on measuring inequality consider and propose formulas that assume that the income data used is a random sample. This is different in empirical work, since in practice the data are collected from surveys carried out in households, in which the identification of observation units is carried out through one or more selection stages and in most of the opportunities households are chosen with unequal probabilities. This implies that the coefficient is in effect a mere approximation.